- Oct 21, 2025|Gabbie Rhodes|5 min
When you're visualizing complex data, sometimes you need to enhance understanding by creating a fly-through of your 3D model. Learn more.
- Oct 21, 2025|Gabbie Rhodes|6 min
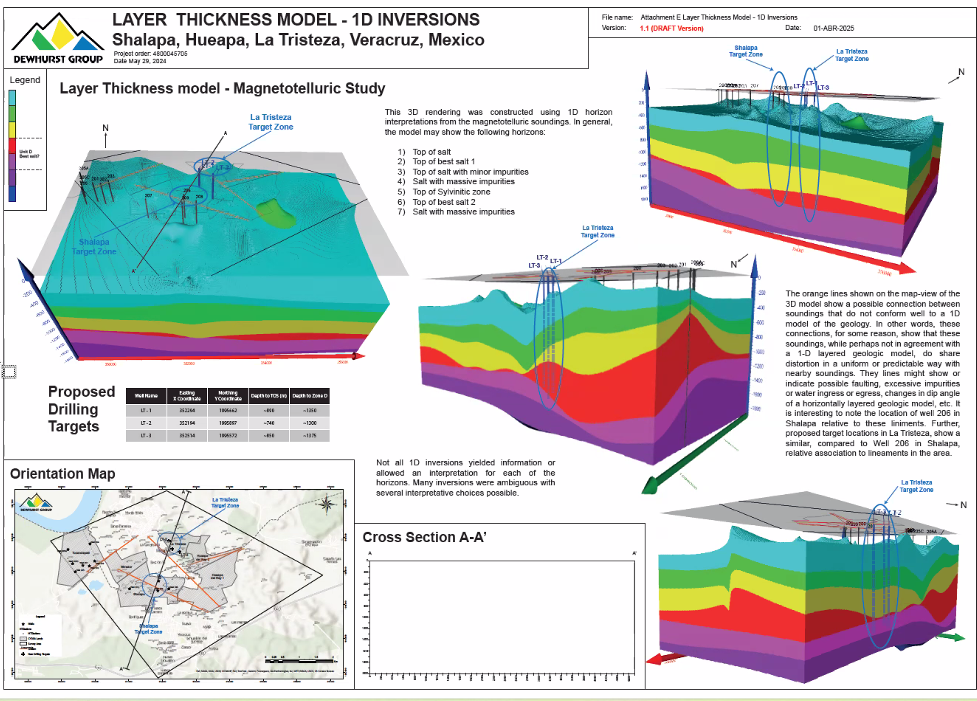
Recently, the Dewhurst Group had to take an untraditional data analysis approach to create a monster map that visualized pure salt in Mexico.
- Oct 15, 2025|Gabbie Rhodes|6 min
To prepare the next generation of scientists, WMU has a hydrogeology field camp. Professor Dogan is one of the instructors helping equip students.
- Oct 15, 2025|Gabbie Rhodes|5 min
How can you know your grid is accurate? There's only one good solution: validating your grid results. Learn how to do it in Surfer!
- Oct 8, 2025|Gabbie Rhodes|4 min
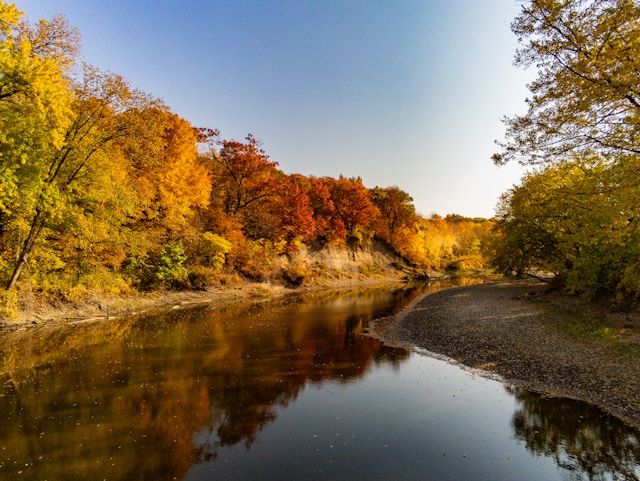
When did the Des Moines River’s freshwater clam species die off? Archaeologist and Iowa State University Professor Matthew Hill shares insights.
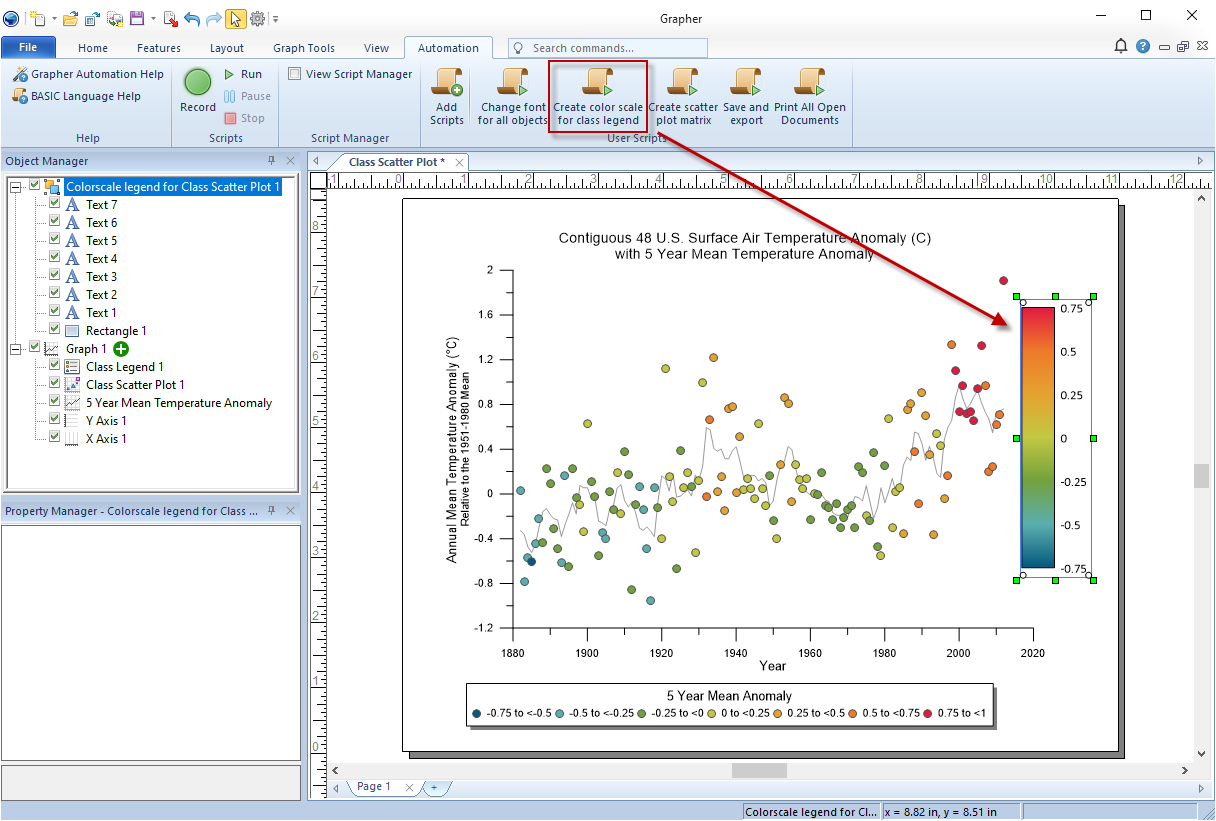
- Oct 8, 2025|Gabbie Rhodes|7 min
Want to automate parts of your map-making workflow? There are various types of scripts you can use to create maps more efficiently.
- Sep 30, 2025|Gabbie Rhodes|5 min
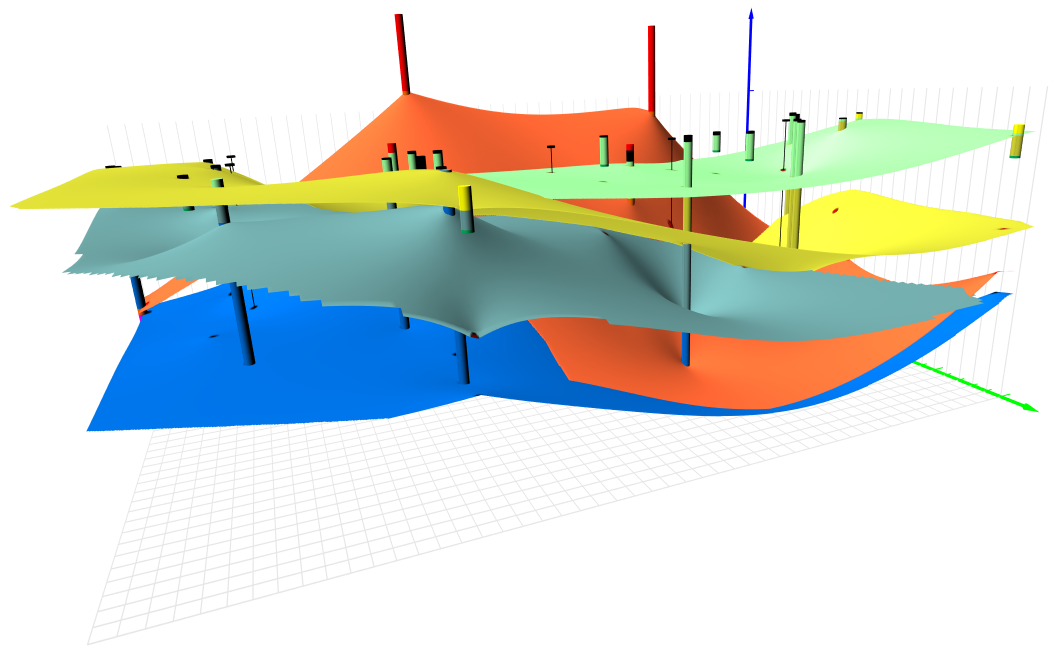
When you're visualizing surface and subsurface data, sometimes you need multiple light sources to ensure the main parts are visible. Learn more.
- Sep 30, 2025|Gabbie Rhodes|7 min
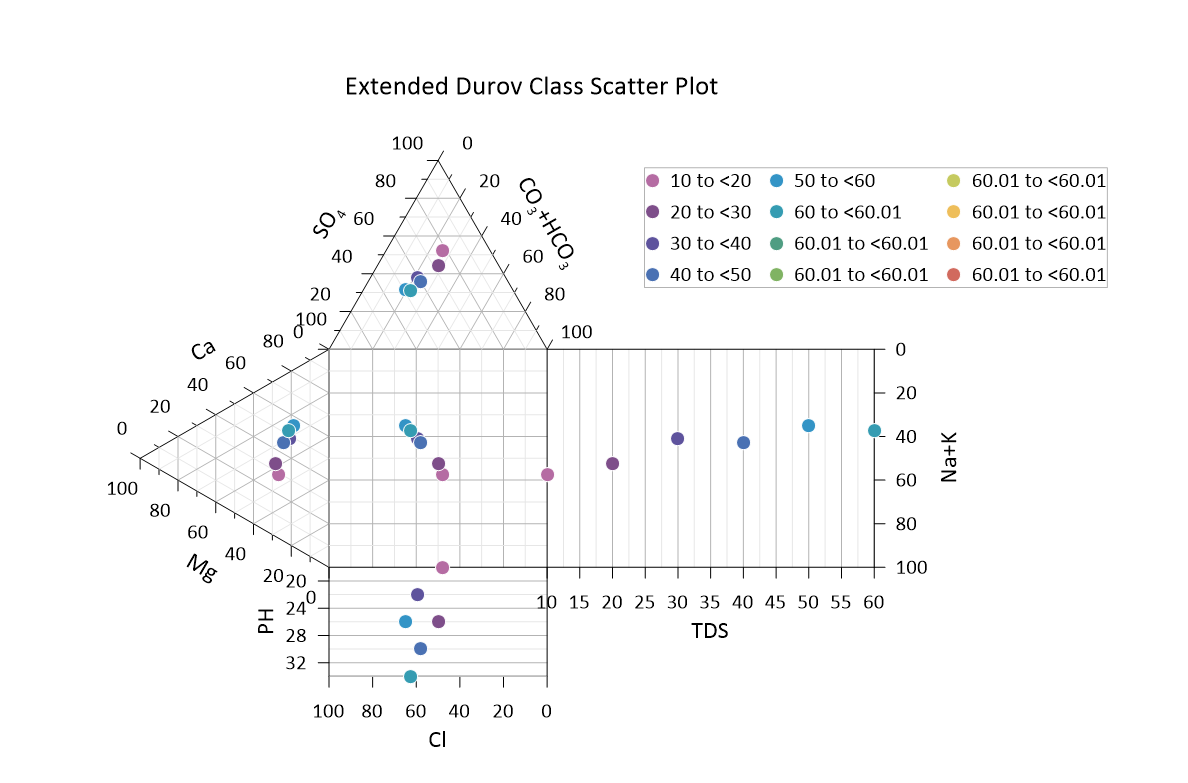
Do you create and recreate durov diagrams often? If so, read our 101 guide on how to create this plot efficiently and effectively.
- Sep 24, 2025|Gabbie Rhodes|5 min
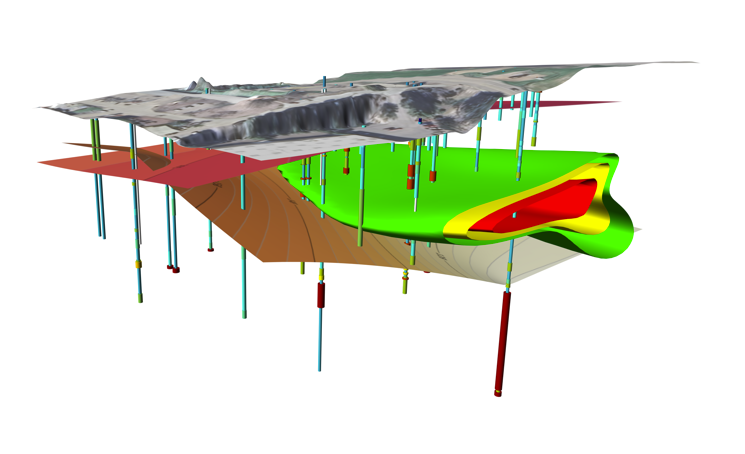
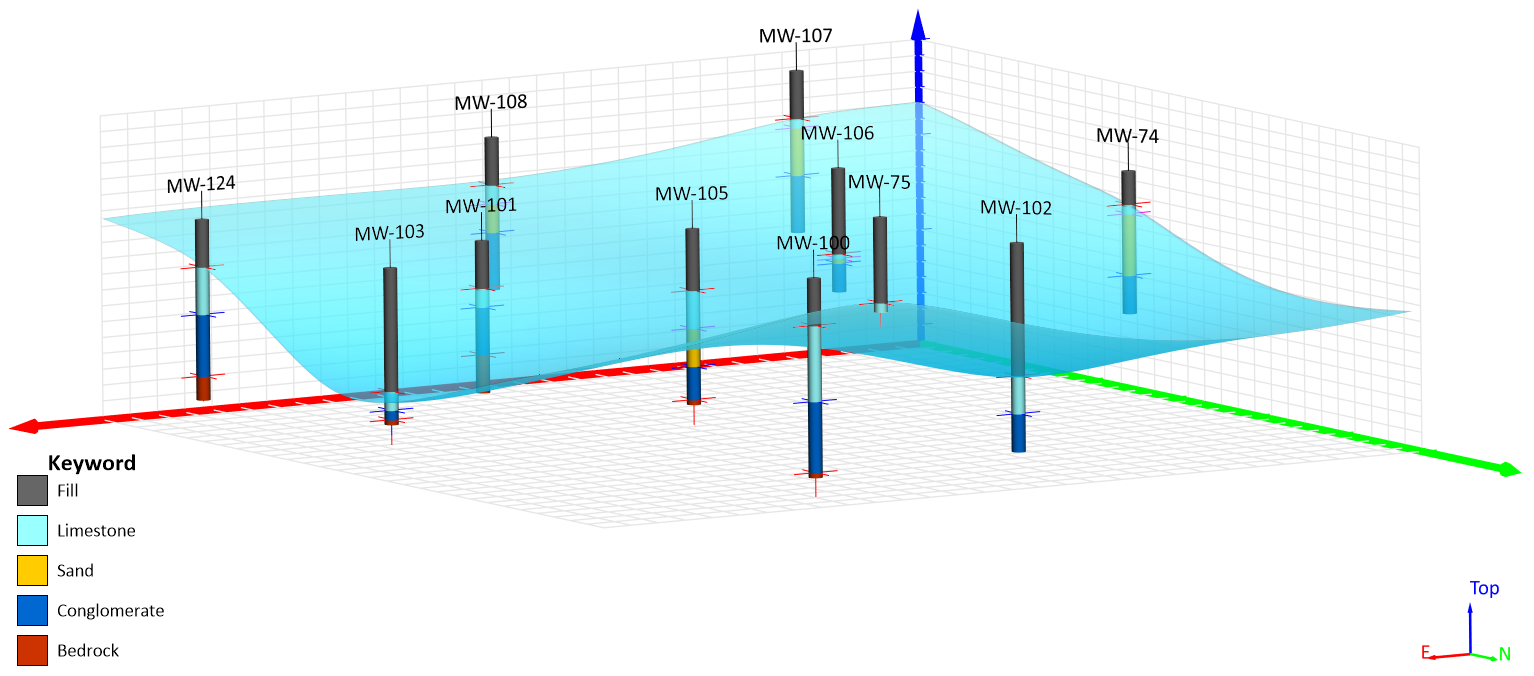
Do you want to showcase underground feature with clarity and precision? Create contact drillhole contacts and surfaces show lithologies & more.
- Sep 24, 2025|Gabbie Rhodes|6 min
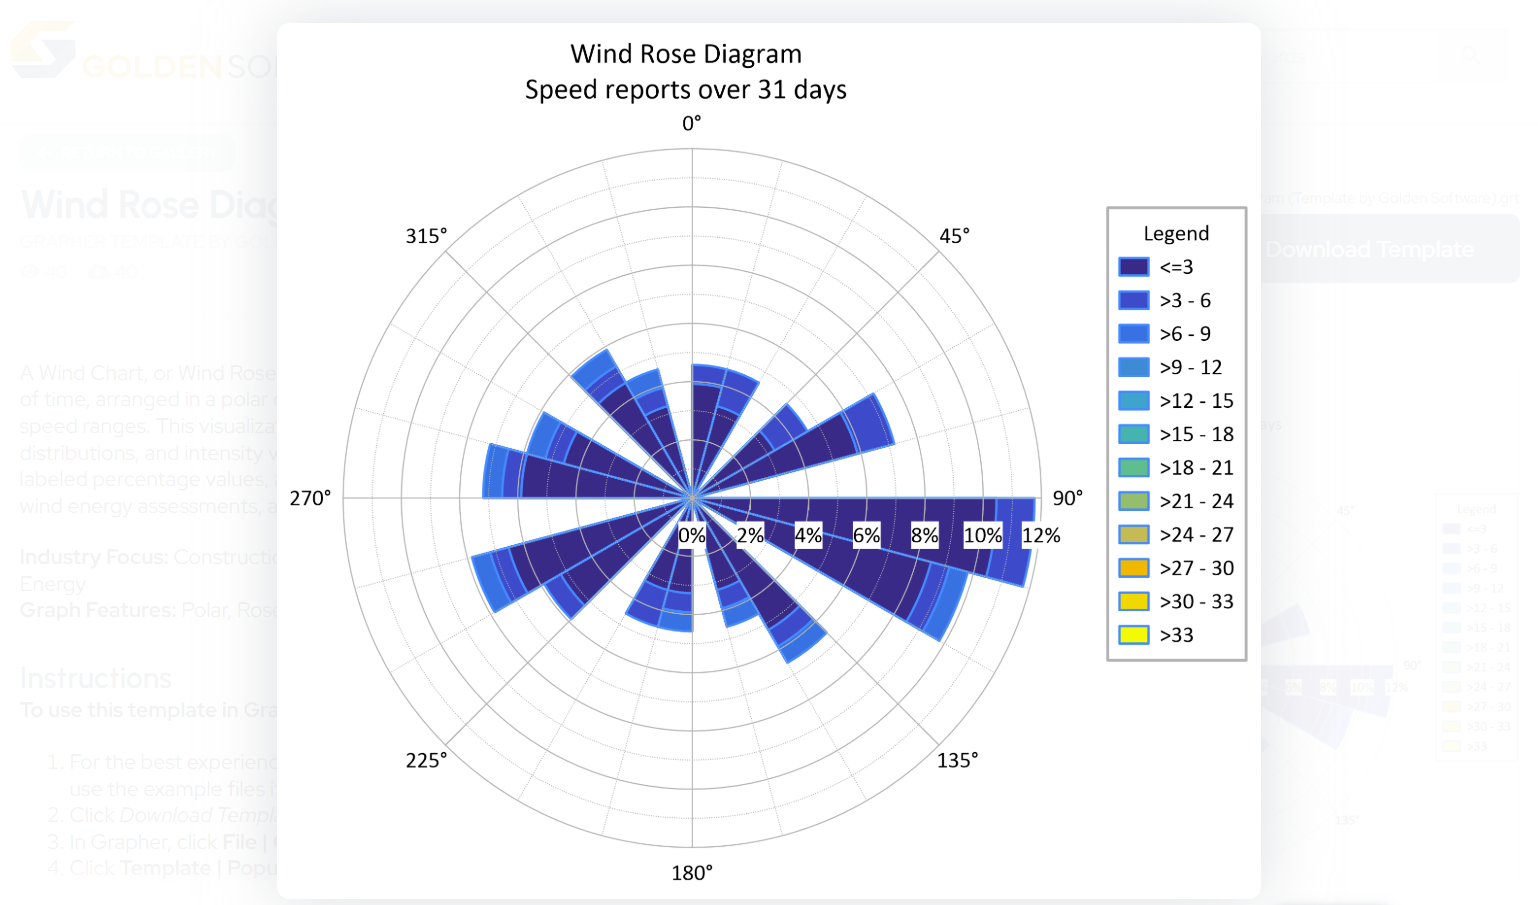
Do you create and recreate wind rose diagrams often? If so, read our 101 guide on how to create this plot faster and more easily.
- Sep 17, 2025|Gabbie Rhodes|7 min
There are several new features in Surfer Beta that you can use to enhance and streamline your workflow! Curious to learn more? Read more.
- Sep 10, 2025|Gabbie Rhodes|6 min
The newest version of Surfer is designed with your biggest priorities in mind: enhancing efficiency and helping stakeholders understand findings.
- Sep 10, 2025|Gabbie Rhodes|7 min
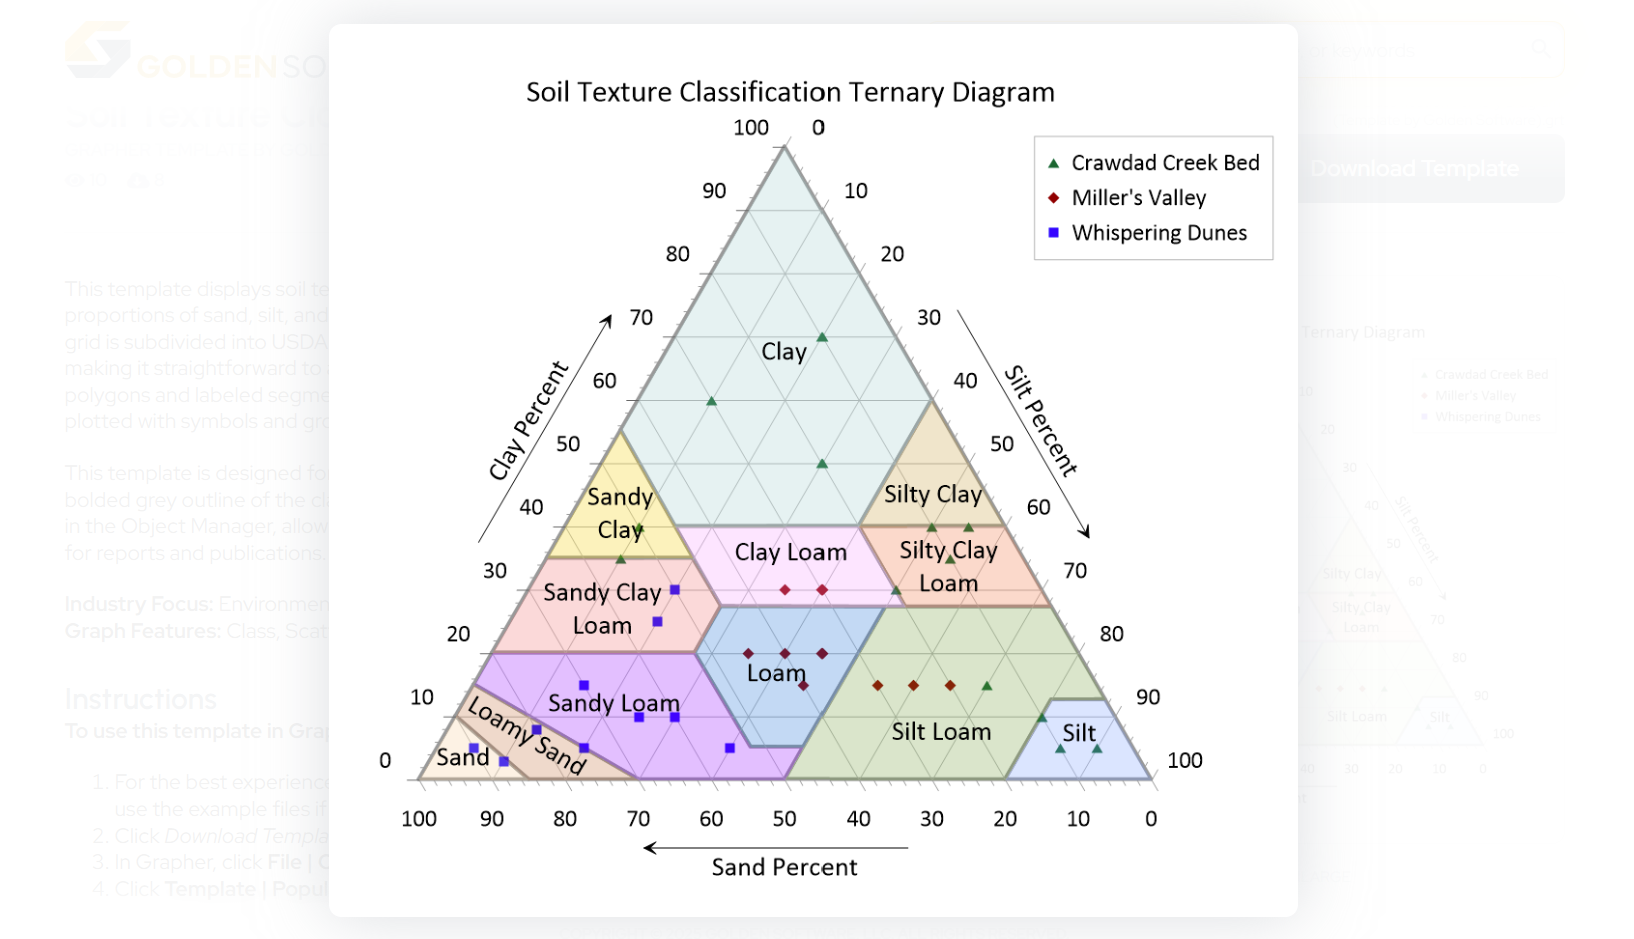
Do you create and recreate ternary plots? If so, check out our 101 guide on how to create a ternary class scatter plot to speed up your process.
- Sep 3, 2025|Gabbie Rhodes|10 min
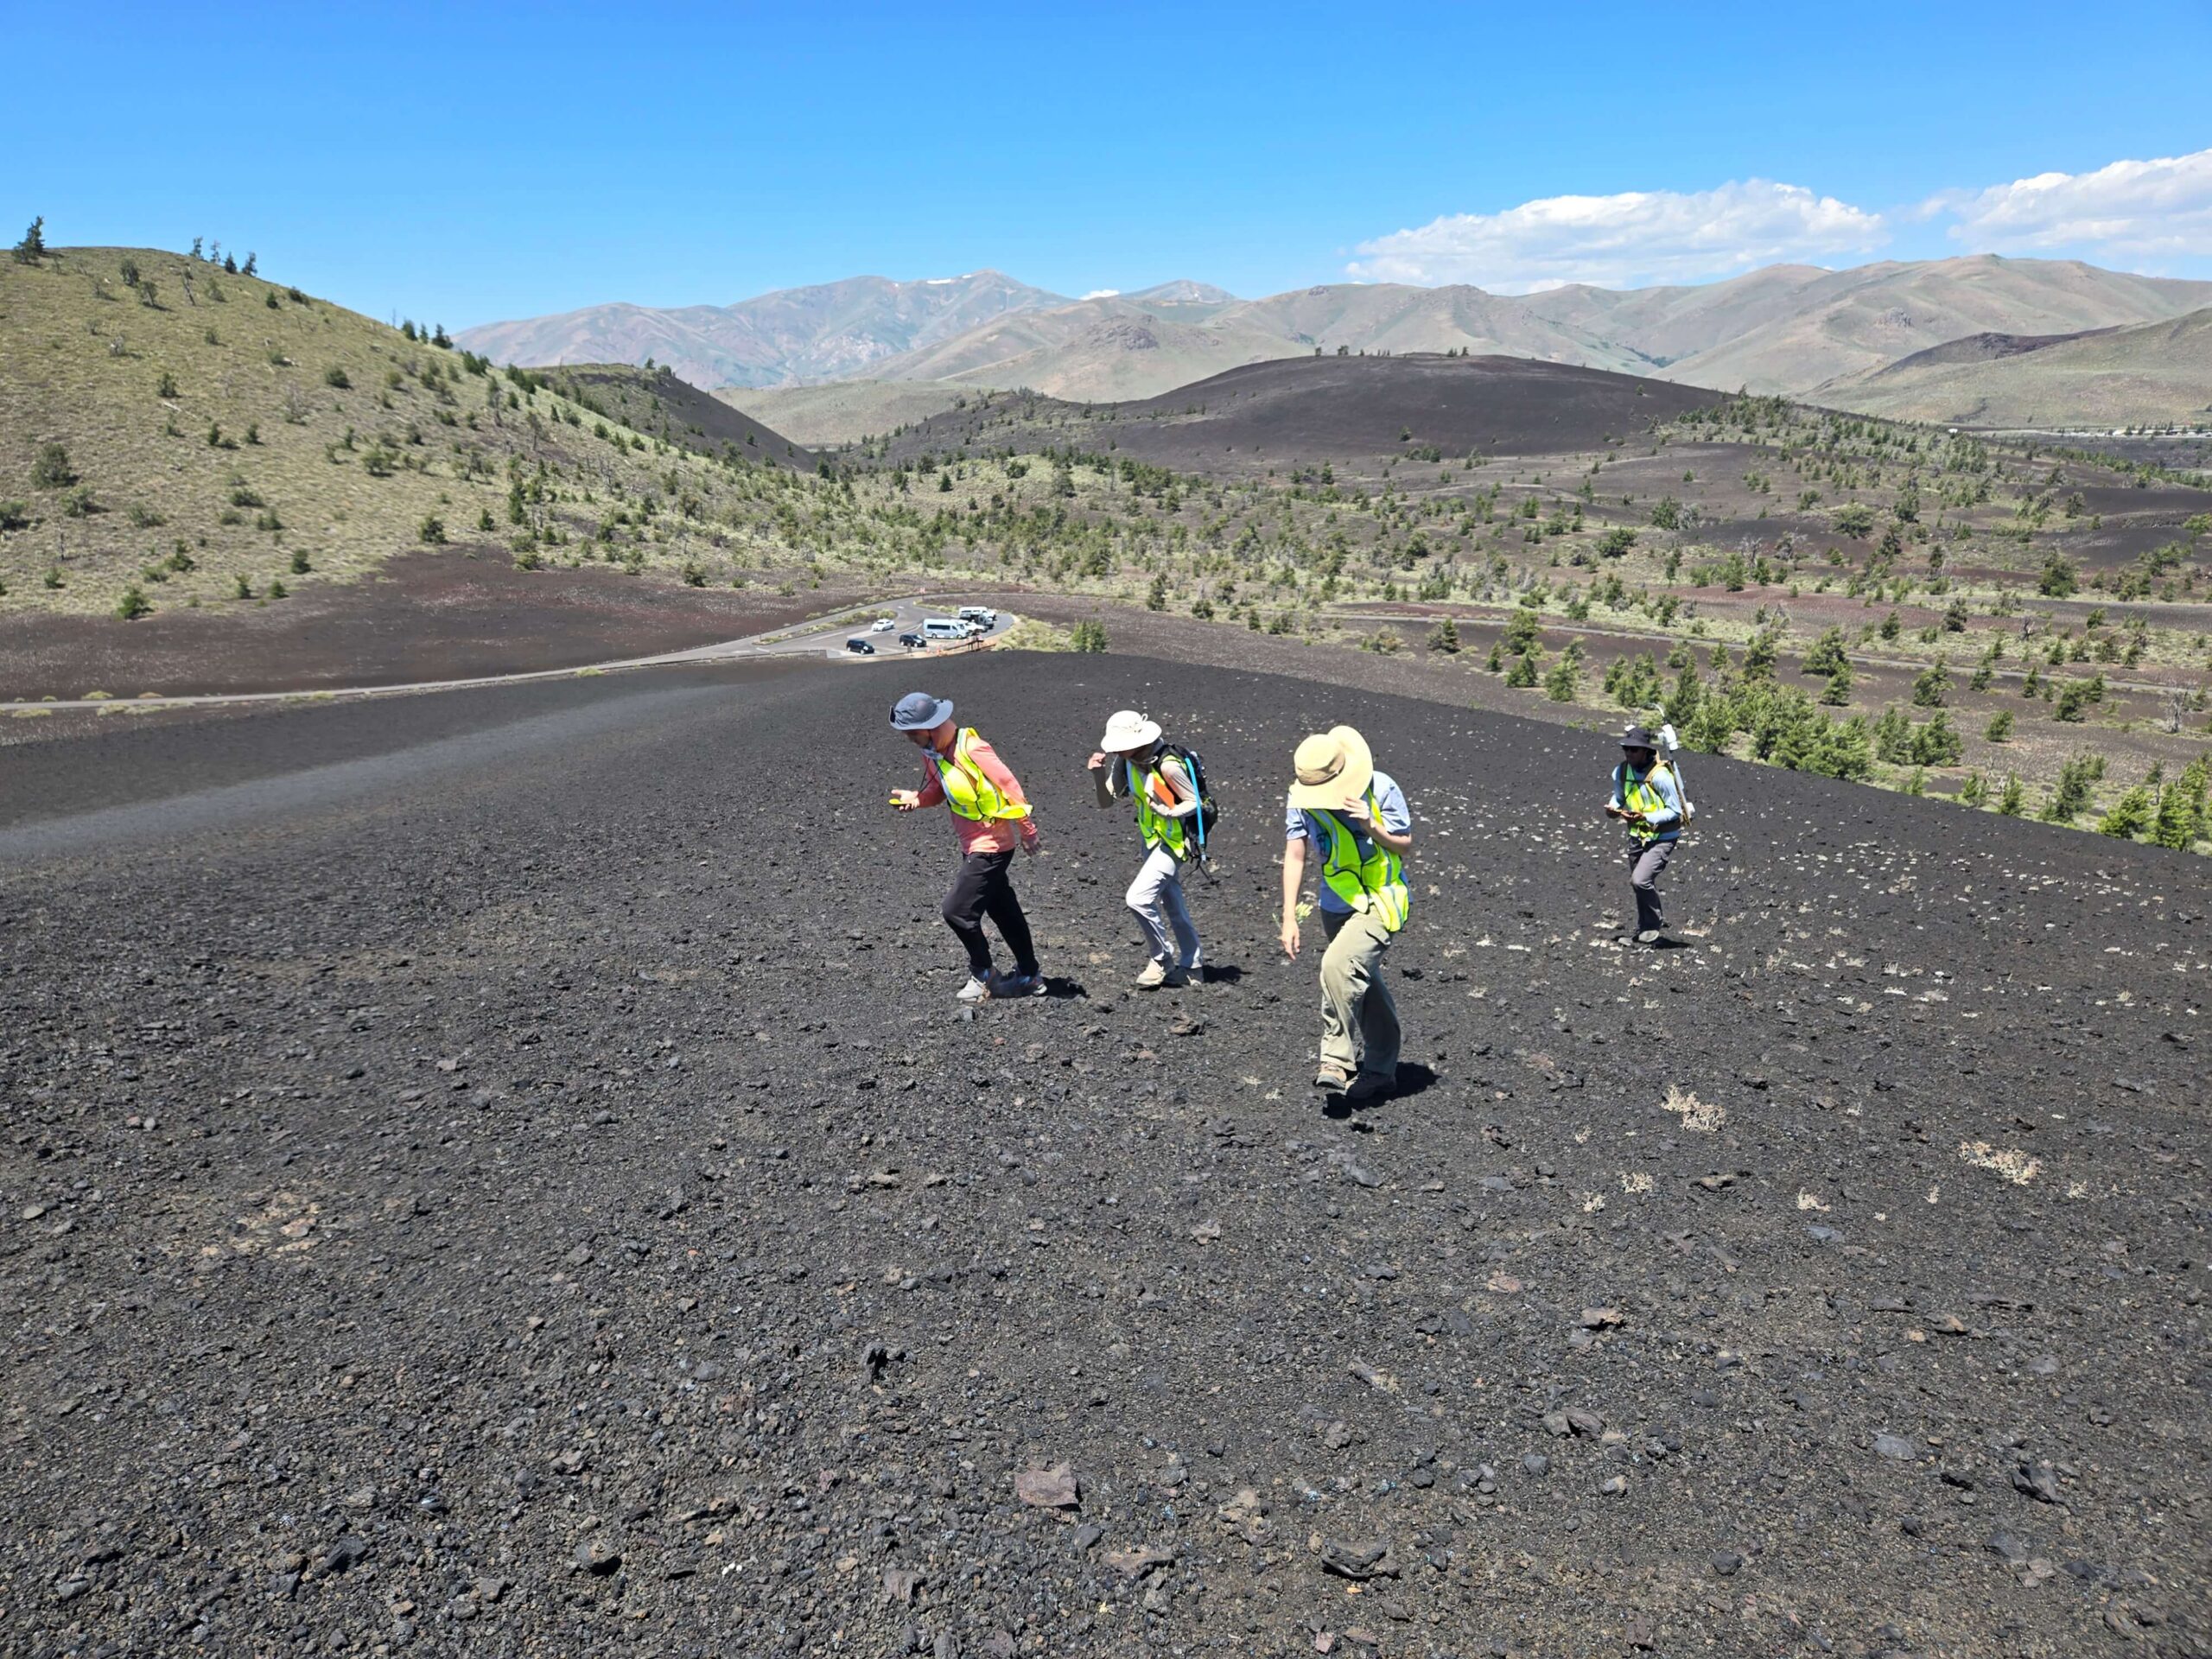
Get a glimpse into the University of South Florida's field camp, which includes a geophysics course in Idaho, advanced equipment, and Surfer.
- Sep 3, 2025|Gabbie Rhodes|8 min
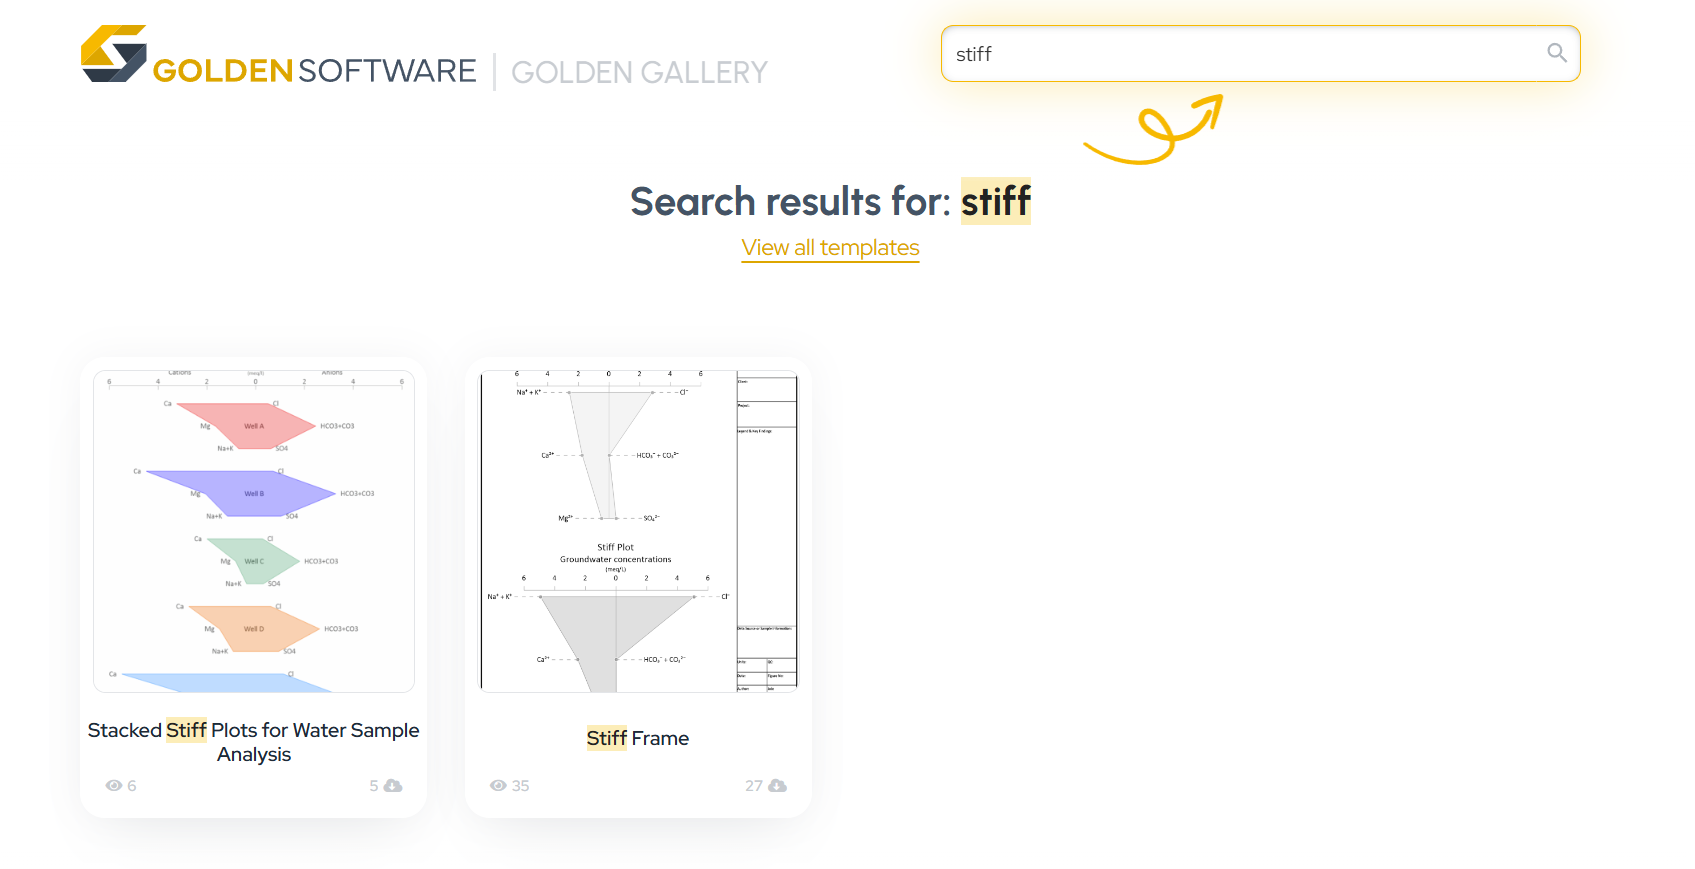
Do you regularly create and recreate stiff plots? If so, check out our 101 Guide to Stiff Plots to learn how to speed up your visualization process.
- Aug 28, 2025|Gabbie Rhodes|5 min
Do you regularly assess water quality for stakeholders? Then, you need to transform your water quality data into great visualizations.
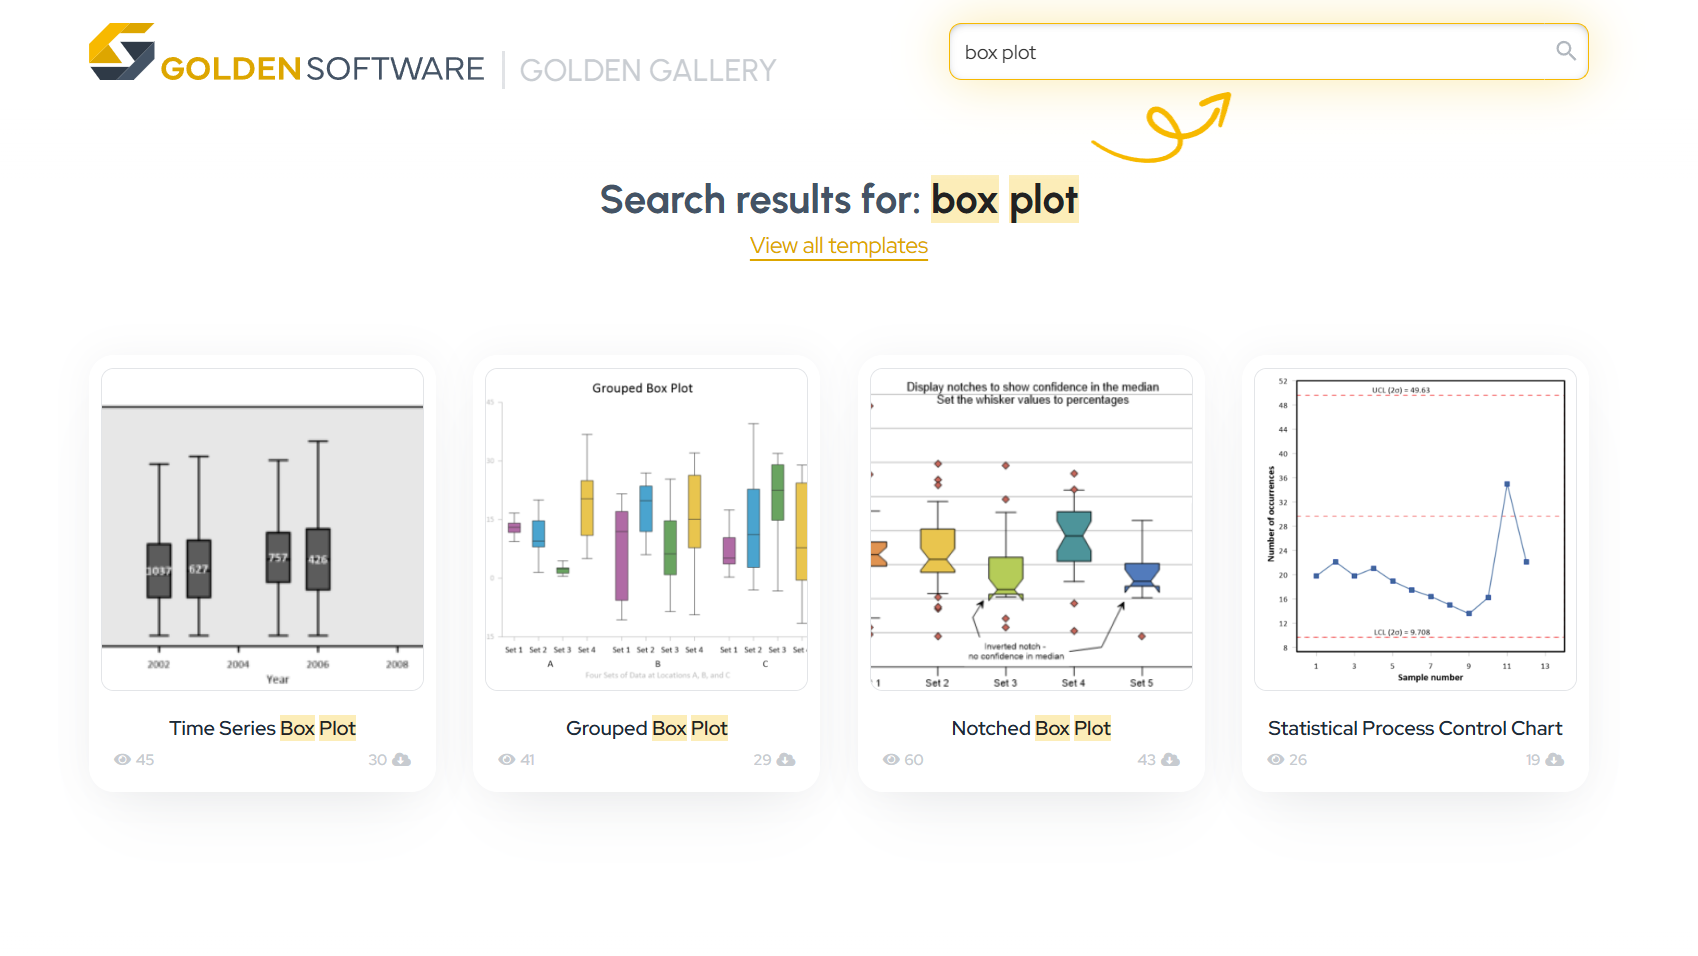
- Aug 28, 2025|Gabbie Rhodes|9 min
If you're in geoscience, you may find yourself creating and recreating various types of box plots. Our Guide to Box Plots can help you do it with ease.
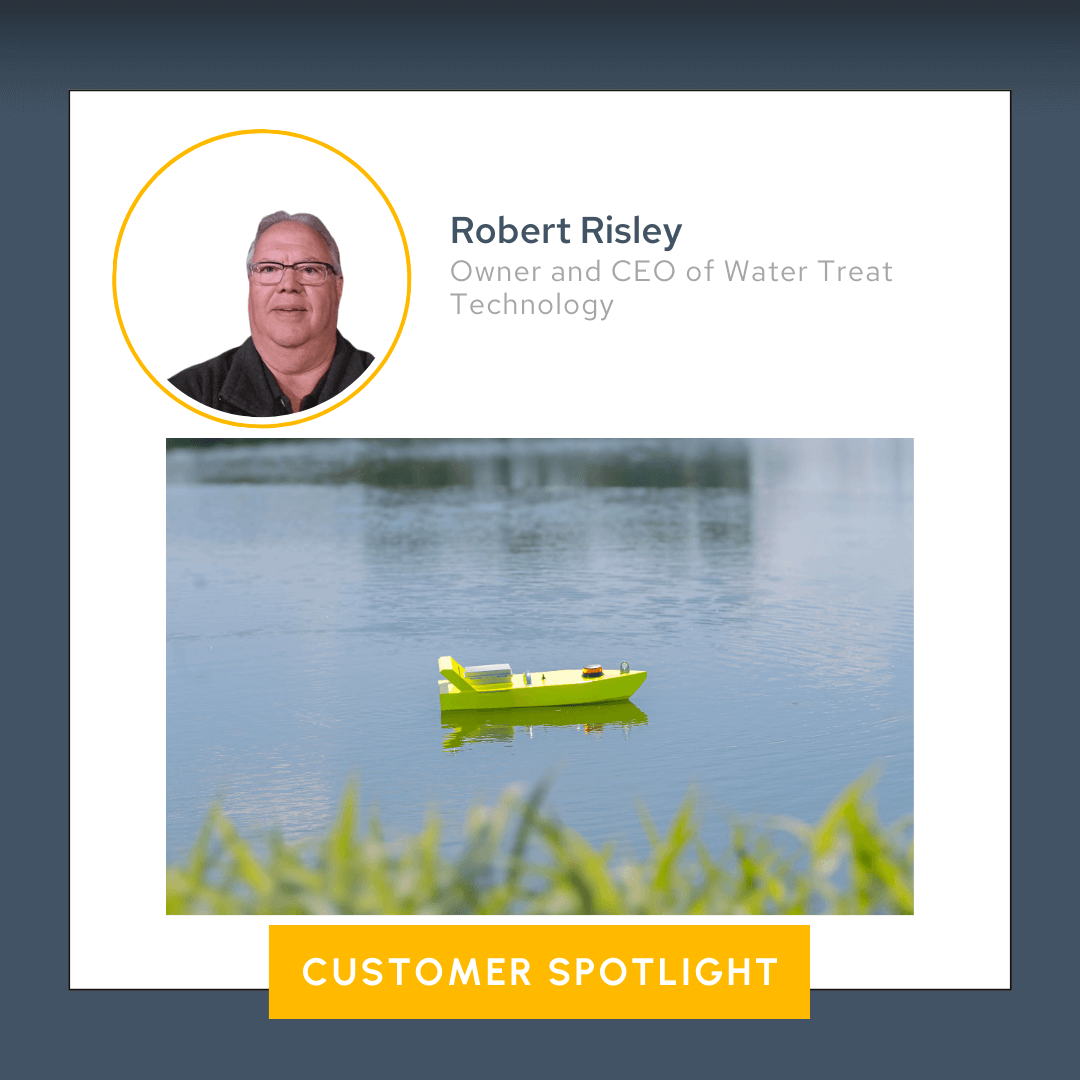
- Aug 20, 2025|Gabbie Rhodes|6 min
Water Treat Technology specializes in lagoon sludge surveys, helping manufacturers and municipalities see sludge buildup and when to remove it.
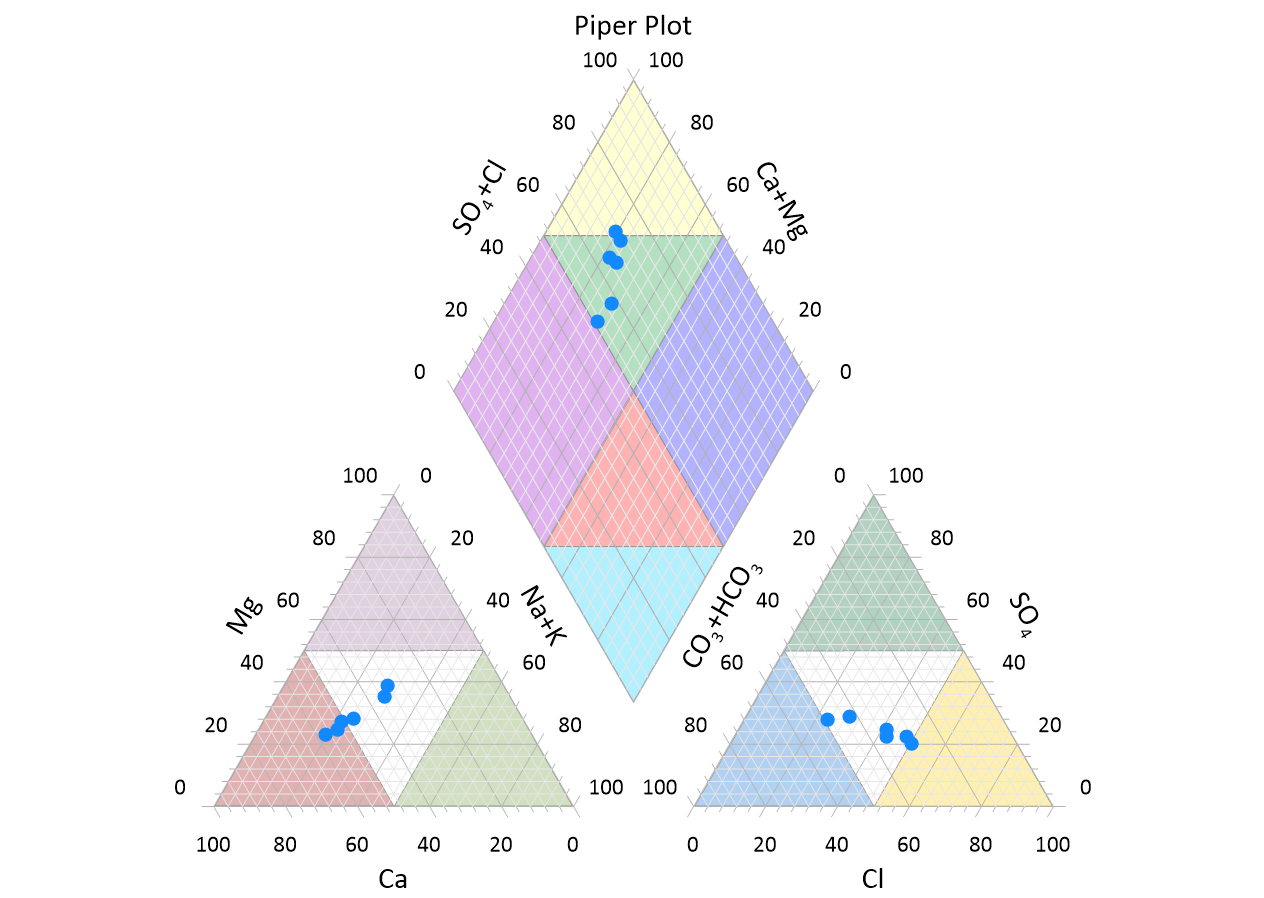
- Aug 20, 2025|Gabbie Rhodes|7 min
If you're in geoscience, you may find yourself regularly creating and recreating piper plots. Our Guide to a Piper Plot can help you do it with ease.
- Aug 13, 2025|Gabbie Rhodes|6 min
The latest features in Grapher Beta are designed to provide more value to your workflow. Discover how you can use them in your industry.